Slow Penetration
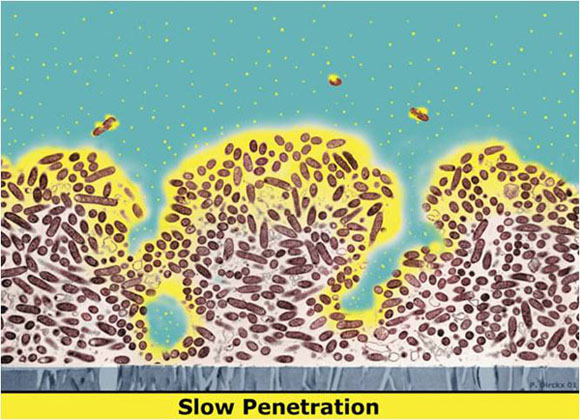
Perhaps the most intuitive explanation for why biocides and antibiotics fail to kill microbes in a biofilm is that the antimicrobial agent, here shaded yellow, simply fails to penetrate past the surface layers of the biofilm (Figure 1). In this diagram the attachment surface is at the bottom and the fluid in which antimicrobial is delivered is at the top.
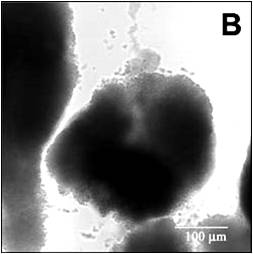
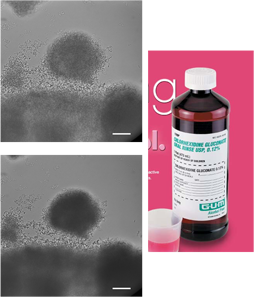
This video shows the penetration of a red fluorescent dye – rhodamine B – into a staphylococcal biofilm cell cluster (Rani et al, 2005). The biofilm was grown in the same capillary reactor system described above. Rhodamine B has a molecular weight of 442 so it is similar in size to some biocides and small antibiotics. This molecule carries some negative charge (a carboxylic acid group), some positive charge (a cationic nitrogen), and some has some hydrophobic character (ethyl groups).

It sorbs reversibly to biomass. This image shows the cell cluster, imaged in transmission mode, before introduction of the dye (Figure 2). To begin the experiment, the confocal microscope imaging is switched from transmission mode to the red fluorescent channel. Everything is dark to begin with. Then the flow of buffer is switched to buffer containing rhodamine B. As the dye enters the flow cell, it first stains the periphery of the cell cluster, then moves progressively into the cluster interior (Video 1). The biofilm deforms from one image to the next, again a reminder that these are pliant, not rigid, structures. After a while, the flow was switched back to buffer lacking rhodamine and one can observe the out-diffusion of the dye. Red color dissipates from the edges of the cluster first, lingering longest in the cluster center, then fades.
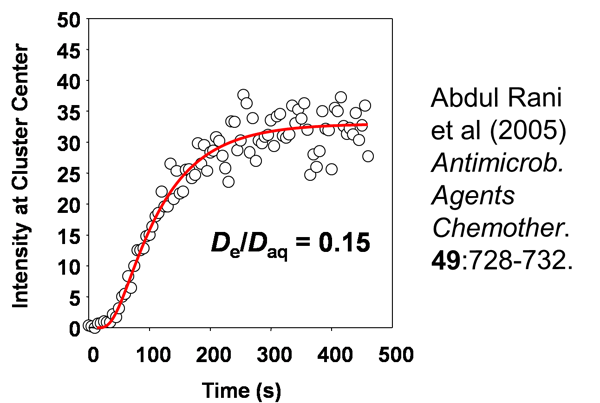
Image analysis can be performed to quantify the information in such movies. This is the red fluorescent intensity at the center of a cell cluster as a function of time after introduction of rhodamine B into the system (Figure 3). The S-shaped curve is a characteristic diffusion result and the data (open circles) can be fitted to a model of unsteady diffusion in a hemisphere (red line). In this case, the data indicate a value for the effective diffusion coefficient of rhodamine in the biofilm that is about 15% of its value in pure water. The take home message here is that this sticky, antibiotic-sized tracer can access the center of a large, dense staphylococcal cell cluster within 300 s – 5 minutes. In the context of antibiotic therapy, the duration of which is typically measured in days, this is fast. A delay of a few minutes will not buy much protection. On the other hand, in the context of a mouthrinse, in which the exposure time might be 20 or 30 s, this is slow.
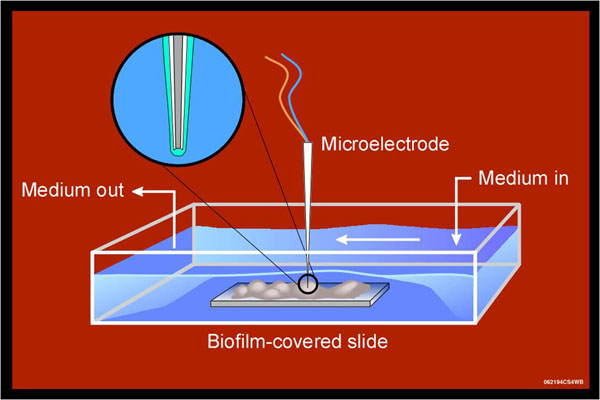
Another way to measure solute penetration in biofilms is with microelectrodes (Figure 4). These are needle-shaped electrochemical sensors, the tip of which is engineered to detect a particular chemical species. In the first example we will examine, the electrode detects hydrogen peroxide. In this experiment, two microelectrodes were used. The first was positioned at the base of the biofilm just a little above the stainless steel slide on which it was grown. A second electrode was positioned directly above this spot in the fluid flowing over the biofilm. The electrodes are fixed in these positions. Now when a hydrogen peroxide solution is introduced into this flow cell, the concentration of hydrogen peroxide that is being delivered to the surface of the biofilm and the concentration of hydrogen peroxide that reaches the base of the biofilm can be simultaneously recorded in time.
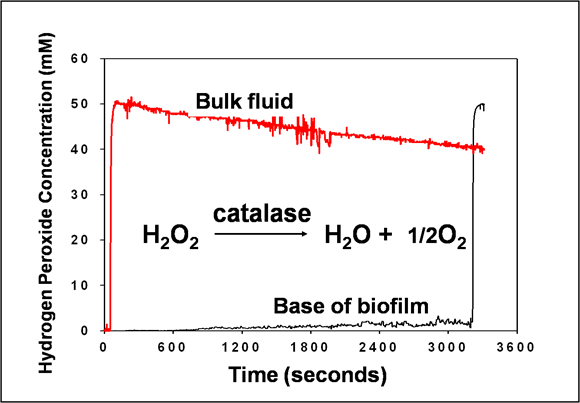
This graph shows the failure of hydrogen peroxide to appear at the base of the biofilm even though 50 mM hydrogen peroxide is flowing continuously over the top of the biofilm (Stewart et al, 2000) (Figure 5). The biofilm in this case is a Pseudomonas aeruginosa biofilm that is about 100 microns thick. At about 3200 s in this experiment, the lower electrode was pulled up into the bulk fluid just to make sure it was working. The spike in signal demonstrates that the electrode is functioning. Why does hydrogen peroxide, MW 34, fail to penetrate during 50 min whereas in the preceding example rhodamine B, MW 442, penetrated in 5 minutes? The answer is that P. aeruginosa, like many other microorganisms, contains enzymes that split hydrogen peroxide into water and oxygen. Hydrogen peroxide is mobile in the biofilm, but it is being consumed in the surface layers faster than it diffuses. This mechanism, which depends on a reaction-diffusion interaction, is a very powerful protective defense.
See chapter 10 for a calculation of the depth of hydrogen peroxide penetration into biofilm based on this experiment. The predicted penetration depth is about 30 microns, not enough for the antimicrobial to reach the bottom of the biofilm.
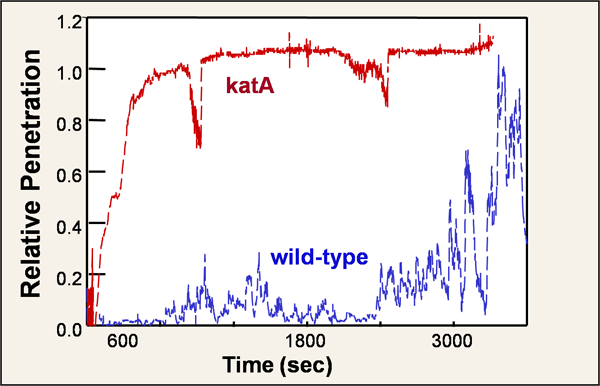
An elegant test of the role of reaction in limiting antimicrobial penetration is to turn the reaction off. This can be achieved in the case of hydrogen peroxide by using a mutant in which the major housekeeping catalase of P. aeruginosa, KatA, has been knocked out (Stewart et al, 2000). Bacteria lacking the katA gene form a normal biofilm and, as shown in this slide, hydrogen peroxide can reach the base of the mutant biofilm faster than it does in a wild type biofilm. This graph shows the signal received from microelectrodes at the base of the respective biofilms (Figure 6). The y-axis is the concentration measured at the base of the biofilm divided by the concentration in the bulk fluid in each experiment. A value of 1 on the relative penetration scale corresponds to full penetration of the hydrogen peroxide.
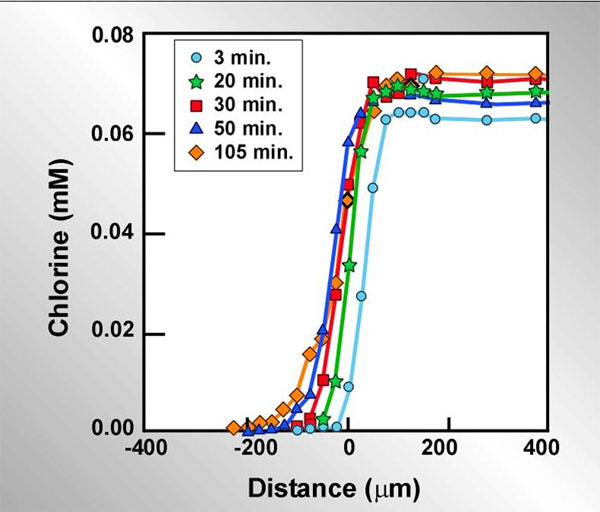
Slow or incomplete penetration of an antimicrobial agent due to a reaction-diffusion interaction depends on a sufficiently rapid neutralizing reaction occurring in the biofilm. Another class of antimicrobials that are highly reactive and fit this condition is the halogens. Using a chlorine-sensitive microelectrode, de Beer et al. (2004) measured concentration profiles of chlorine inside a biofilm exposed to a flowing solution of hypochlorite/hypochlorous acid at neutral pH (Figure 7). Zero on the x-axis corresponds to the biofilm-bulk fluid interface. The chlorine solution is indicated by the positive numbers to the right and the biofilm is indicated by negative numbers. The stainless steel coupon that the biofilm was grown on was located at approximately -300 microns in this experiment. In this experiment, chlorine concentrations around and in the biofilm were measured at the same spot in the biofilm at different times after initiating treatment with chlorine. Very clearly chlorine does not penetrate the biofilm. Even after more than an hour and a half of treatment, there was little advance in the chlorine front. Chlorine is being consumed by uncharacterized reaction with the biomass. The biofilm is a dense reservoir of organic matter. Chlorine will eventually burn its way into the biofilm, but it must deplete the neutralizing capacity of the biomass layer by layer to do this.
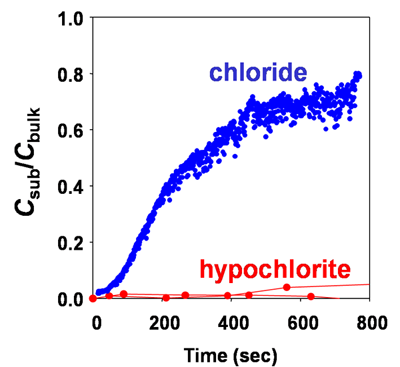
To underscore the importance of reactivity in governing penetration consider this comparison of the penetration of the chloride ion (Cl-, from sodium chloride) and the hypochlorite ion (OCl-, from bleach). These two ions have nearly the same diffusion coefficient in water at 25oC: 2.0 x 10⁻⁵ cm2 s-1 for Cl- and 1.9 x 10⁻⁵ cm2 s-1 for OCl-. The penetration of the two chemical species into a biofilm is very different (Figure 7). Two different microelectrodes were used in this study (Stewart et al, 2001), an amperometric electrode for hypochlorite and a potentiometric electrode for chloride. Both microelectrodes were positioned near the bottom of a thick biofilm on a section of pipe extracted from a kitchen drain lateral. Solutions of chloride or hypochlorite were then flowed over the biofilm and the relative penetration determined. The y-axis is the concentration at the substratum divided by the bulk fluid concentration. Whereas chloride penetrates, hypochlorite does not. This is because hypochlorite is reactive and is being consumed but chloride is biologically inert and is not transformed.
Now we return to the question of how quickly an antimicrobial mouthrinse can penetrate into dental plaque. In the experimental video shown here, a biofilm of three oral bacteria was grown in the capillary reactor system (Figure 8) (Takenaka et al, 2008). The biofilm was pre-stained with CAM as described above and then a chlorhexidine gluconate-containing mouthrinse was pumped into the flow cell. The time-lapse movie is 20 minutes long and it clearly shows a penetration front of antimicrobial action advancing inward into the cluster. It takes about 450 s for the chlorhexidine to effect significant loss of green color at the center of the cells cluster. This is much longer than the duration of a typical rinse with such a product. Chlorhexidine may be reacting or binding in the biofilm retarding its penetration. Note that the mouthrinse causes permeabilization of cells in the biofilm but does not cause any removal of biomass. There does seem to be a slight contraction and darkening of the biofilm as a result of the treatment.
In summary, biofilms are mostly water and solutes the size of most biocides and antibiotics can diffuse in the biofilm. They do not move as fast as they would in pure water because the cells, EPS, and other constituents of the biofilm hinder their mobility. But measurements of diffusion coefficients suggest that these solutes will typically diffuse at rates approximately 20 to 50% of their rate in water (see chapter 10 for more on diffusion). When a rapid neutralizing reaction occurs, the biofilm behaves like a reactive sponge and consumes the antimicrobial agent as it diffuses into the biofilm. This powerful protective mechanism is probably important for reactive oxidants such as hydrogen peroxide or chlorine. For many other antimicrobials, there is no fast neutralizing reaction and the antimicrobial can penetrate the biofilm according to the dictates of diffusion.
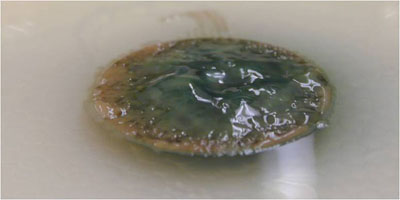
Most antibiotics probably penetrate biofilms adequately. As an illustration, consider the penetration of ciprofloxacin or tobramycin through P. aeruginosa biofilms (Walters et al, 2003). These drugs are used to treat persistent lung infections by this microorganism. In a simple in vitro biofilm model termed the colony biofilm, the bacteria grow on top of a membrane resting on an agar plate (Figure 10). Each day the membrane and attached biofilm is picked up with a pair of sterile forceps and transferred to a new plate to provide fresh nutrients. If this process is continued for 10 days, the biofilm develops a colored, bumpy, glistening appearance (Figure 10). These biofilms do not look anything like a simple colony on a plate. Already after two days, the colony biofilm acquires the antibiotic-tolerant phenotype that is a hallmark of the biofilm state. Colony biofilms of P. aeruginosa that were grown for 48 h then transferred to a plate containing either tobramycin or ciprofloxacin were poorly killed by the antibiotic.

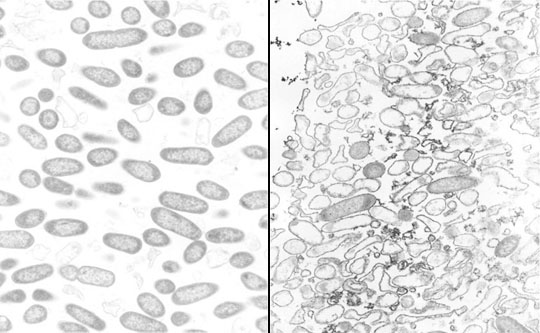
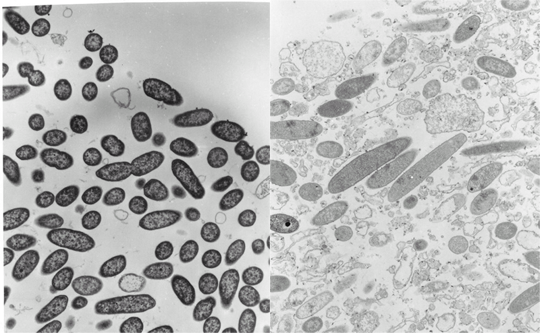
When antibiotic-treated P. aeruginosa colony biofilms are examined by transmission electron microscopy (TEM), evidence of antibiotic action is easily found. In a biofilm that has not been exposed to antibiotic, the bacterial cells appear as short rods throughout the depth of the biofilm (Figure 11). In contrast, in a ciprofloxacin-treated biofilm lysed cells, cell debris, and filamented cells (characteristic of the mode of action of the fluoroquinolones) are obvious. Both of the images in this figure were taken at the air interface of the biofilm. This means that the antibiotic came up from the agar, through the membrane, all the way through the colony biofilm and acted on bacteria at the opposite edge. This is a nice visual confirmation that ciprofloxacin is able to penetrate the biofilm. Use of a sandwich bioassay also demonstrated that both antibiotics penetrate, though ciprofloxacin moves in faster than tobramycin (Walters et al, 2003).
In both ciprofloxacin-treated and tobramycin-treated P. aeruginosa biofilms, it is interesting to note that visible signs of antimicrobial action are most evident along the air interface of the colony biofilm. For example, in a tobramycin-treated colony biofilm, bacterial cells in the middle stratum of the biofilm appear morphologically normal whereas cells at the air interface appear destroyed (Figure 12). These observations suggest that oxygen availability may be important in controlling antibiotic susceptibility.