Microbial Growth
As discussed in the blue/green levels of this chapter microbial cells use nutrients for growth, energy production and product formation as indicated in the following expression;
Nutrients + microbial cells > cell growth + energy + reaction products
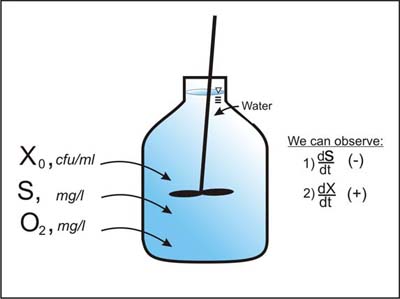
Consider the operation of the "Batch" system shown in Figure 1. This container initially contains a known growth substrate concentration S. The container is well mixed and therefore the dissolved oxygen concentration O2 does not become a limiting factor for microbial growth. Initially a known concentration X of viable microbial cells (i.e. inoculum) is added to the container and, with time, growth substrate S is utilized for cell growth. We therefore over time will observe a decrease in S (negative dS/dt) and a corresponding increase in X (positive dX/dt).
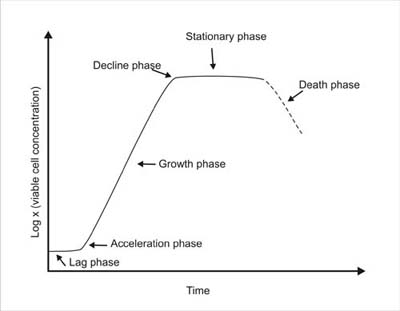
A conceptual plot of microbial cell concentration vs time for the batch system is called a growth curve, as shown in Figure 2.
Microbial Growth Kinetics
During the lag phase dX/dt and dS/dt are essentially zero. However as exponential growth phase begins it is possible to measure dX/dt and dS/dt values which are very useful for defining important microbial kinetic parameters. Using corresponding observations of dS/dt and dX/dt obtained just after the onset of exponential growth phase in Figure 2 we can compute the yield coefficient YXS and the specific growth rate µ as:Yield coefficient
![]() (1)
(1)
Specific growth rate
![]() (2)
(2)
The yield coefficient, commonly referred to as the substrate-to-biomass yield, is used to convert between cell growth rate dX/dt and substrate utilization rate dS/dt. The yield coefficient and the specific growth rate used to develop three types of microbial growth kinetic relationships; Monod , first order ,and zero order kinetics.
Monod Kinetics
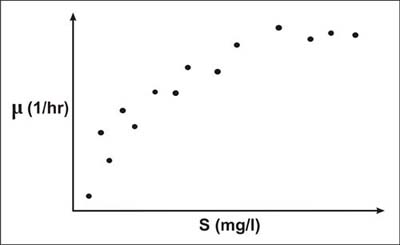
The batch experiment shown in Figure 1 can be repeated by varying initial substrate concentration S over a wide range of values—resulting in observation of individual µ values which correspond to each substrate concentration. An arithmetic plot of µ vs S will exhibit the general behavior shown in Figure 3.
The most widely used expression for describing specific growth rate as a function of substrate concentration is attributed to Monod (1942, 1949). This expression is:
![]() (3)
(3)
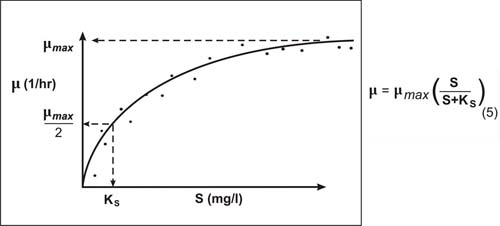
Figure 4. Shows conceptually how the Monod equation is fit to the observed substrate and specific growth rate data in Figure 3. In Figure 4 it is seen that µmax is the maximum specific growth rate observed and KS is the substrate concentration corresponding to 1/2 µmax.
Monod Kinetics
By combining equations 2 and 3 we can write the following expression for time-rate-of-change of biomass:
![]() (4)
(4)
Similarly, by combining equations 1 and 3 we can write an expression for substrate utilization rate.
![]() (5)
(5)
First Order Kinetics
Equation 5 describes the Monod kinetic relationship for substrate utilization. From Figure 4 it can be seen if S << KS , Equation 5 can be approximated as:
![]() (6)
(6)
Equation 6 describes the condition where substrate utilization is proportional to substrate concentration (i.e. first order with respect to S).
Zero Order Kinetics
Likewise if S >> KS Equation 5 can be approximated as:
![]() (7)
(7)
Equation 7 describes the condition where substrate utilization rate is a constant (i.e. zero order with respect to S).

