A substantially updated version of the hypertextbook is available here. Please migrate to that version. This one will eventually disappear.
What You See is What You Get
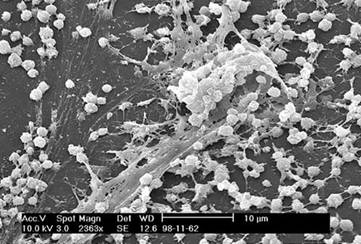
In the 1970s and 80s options for viewing biofilms were chiefly brightfield and electron microscopy (EM-Chap 8). The use of each of these instruments requires the subject to be dehydrated and typically stained (Molecular probes - Chapter 8). The optical resolution of a brightfield microscope (about 0.25 µm) is too small to reveal much detail and although the detail seen under electron microscopy was magnificent, it was misleading. Eighty five to ninety five percent of a biofilm consists of water; the rest is cells, inorganics, and various polymeric materials that are often quite fibrous in nature. The removal of the water, necessary in electron microscopy, results in an image of bacterial cells lying within a flat matrix of fibers. Trying to intuit the nature of a biofilm from electron micrographs is roughly equivalent to deducing the nature of an animal from a long dead road kill.
Confocal Microscopy
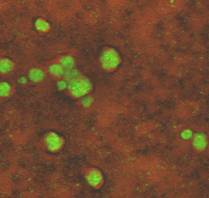
Perhaps the single most significant change that permitted a more realistic view of biofilm structure was the application of confocal microscopy (Confocal Microscopy - Chapter 8 - Link). Confocal microscopy permits the observation of a wet subject on virtually any sort of surface without the need to dry it first.
In confocal microscopy, the illuminating radiation is laser light (below), which passes thorough a pinhole before striking a half silvered or dichroic mirror. The light then passes down through the objective and illuminates the object of interest. If the object is stained with a flurescent dye, or perhaps naturally contains pigments or other materials that fluoresce, it may emit light of a somewhat longer wavelength, which then passes back into the objective lens, and through the dichroic mirror (Chaper 8 - Fluorescent Staining - Link).
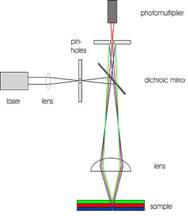
In confocal microscopy, the illuminating radiation is laser light (at left), which passes thorough a pinhole before striking a half silvered or dichroic mirror. The light the passes down through the objective and illuminates the object of interest. If the object is stained with a fluorescent dye, or perhaps naturally contains pigments or other materials that fluoresce, it may emit light of a somewhat longer wavelength, which then passes back into the objective lens, and through the dichroic mirror. Now comes the tricky point which makes the confocal microscope such a useful tool for biofilm research. Notice in the diagram that fluorescent light is being produced at different layers within the object (indicated here by rays colored blue, red and green). If all of this light were to enter the eye of the observer or the photoreceptor tube as shown here, the image would be blurry because of the great depth of field from which the light is emanating. But also notice that in this microscope there is a second pinhole. Only light from a very specific depth within the object may enter the pinhole and be "seen" by the phototube. Light from a greater or lesser depth strikes the light stop and is not seen by the phototube. In effect we have a view of an optical slice of the object which can be recorded as a digital image. By simply moving the objective up or down, a small but very precise distance, we can get another slice and so on. We are essentially sectioning the object optically much as a technician takes a CAT scan or a butcher slices baloney at the meat market. With the aid of a computer we can reassemble these individual images to build an optical reconstruction of the original object. Furthermore the computer can turn the reconstructed image on its side so we can see not only length and width as in a typical microscope but depth as well. We refer to these as x-y and x-z images. With these images we can see what no one had previously observed.