A substantially updated version of the hypertextbook is available here. Please migrate to that version. This one will eventually disappear.
LeftBarAltered Microenvironment
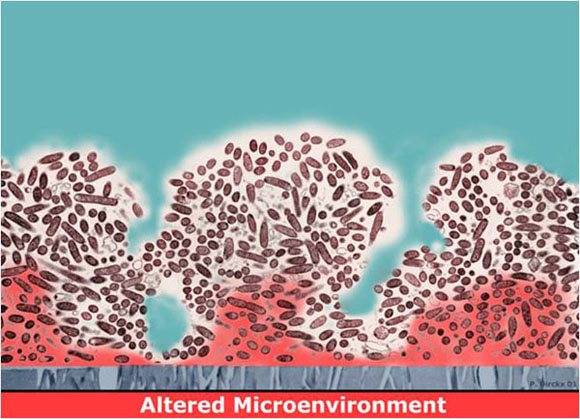
Figure 1 depicts a long-standing explanation for why biofilms are hard to kill. Here the local chemical microenvironment has been altered (red zones), probably through the metabolism of the microorganisms themselves. For example, the red zone could correspond to a region of depleted oxygen, a result of the concerted respiratory activity of the overlying cells. Or this might be a region of depressed pH, if the microbes produce acidic waste products. Such changes could directly antagonize the action of an antimicrobial agent, or they might send the cells in these regions into a less active state. This state could alternatively be termed starved, stationary phase, non-growing, or dormant. Whatever the terminology, inactive cells are likely to be less susceptible to killing by many antimicrobials.
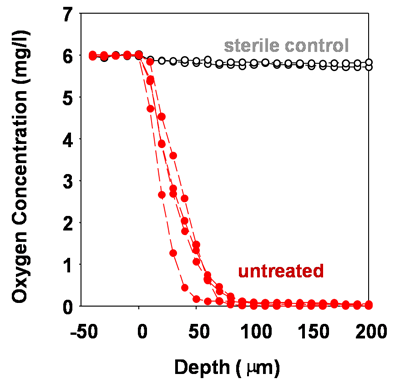
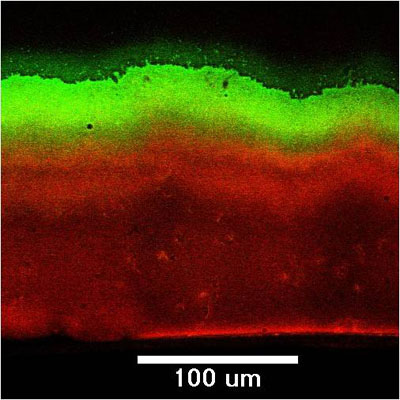
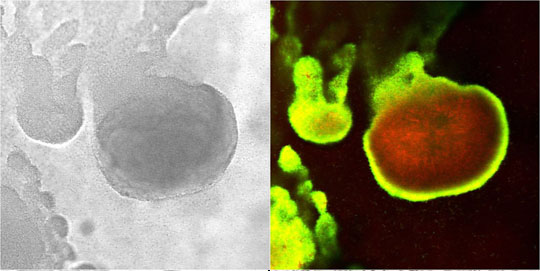
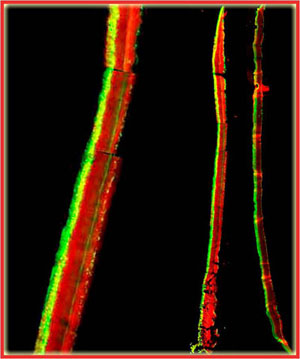
Microscale chemical and biological heterogeneity is a signature feature of mature biofilms. Consider the P. aeruginosa colony biofilm model discussed in a few of the previous figures. When an oxygen microelectrode is lowered into one of these biofilms, a classic profile of diminishing oxygen is measured (Figure 2) (Walters et al, 2003). Within about 50 to 100 microns into the biofilm, the oxygen is gone. To investigate the heterogeneity in the capacity for protein synthesis, Werner et al (2004) used a strain of P. aeruginosa containing an inducible green fluorescent protein (GFP). When exposed to the inducing agent, those bacterial cells capable of de novo protein synthesis make the GFP and appear green when examined by epifluorescence microscopy. In the frozen section in Figure 3, the biofilm has been counterstained with a red dye to indicate the extent of the biofilm. The protein synthetic activity (green) is located in a band along the air interface of the colony. This region of metabolic activity corresponds with the oxic zone (Figure 5) and the region of disruption of cells by antibiotics (Figures 9 and 10, page 4). See module 4 for a calculation of the depth of oxygen penetration into biofilm based on this system. The predicted penetration depth is about 77 microns, which is in reasonable agreement with the oxygen profiles and GFP induction pattern measured experimentally. When the inducible GFP strain is grown in the capillary biofilm reactor (Figure 4), the geometry of the biofilm is different but the message of spatial variation in activity is the same. In this case, oblate hemispherical clusters are formed. When examined for protein synthetic activity, the GFP (green in Figure 4) is found around the periphery of larger clusters. In the center of these clusters (red areas), little protein synthetic activity can be detected. If one were to excise cells from the centers of these clusters and provide them with some nutrients and oxygen they would most likely grow. But in situ in the biofilm, these cells are dormant.
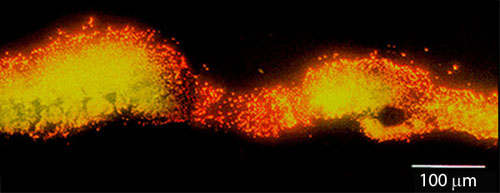
In the example shown in Figure 5, a S. epidermidis colony biofilm has been labeled for DNA synthetic activity (green) (Rani et al, 2007). A red counterstain reveals the extent of the biofilm.
Cell replication is highly stratified. The most intense DNA synthesis occurs along the air interface of the colony, but occasionally a trace of green is observed along the membrane interface or in an internal stratum. These biofilms likely contain bacteria in at least four distinct physiological states: growing aerobically, growing fermentatively, dead, and dormant. The Klebsiella pneumoniae biofilm shown in Figure 29 was grown a continuous flow reactor then stained with acridine orange (Wentland et al, 1996). Cells that stain bright red or orange have a relatively high RNA content and are growing rapidly. Cells that stain green or yellow have a relatively low RNA to DNA ratio and are thought to be growing slowly or not at all. In this frozen section, the steel slide on which the biofilm was grown was at the bottom and the fluid containing nutrients flowed along the top. A band of orange-red activity tracks the biofilm-bulk fluid interface. Where the biofilm is thin, all of the cells appear active. In spots where the biofilm is thicker, the interior of the cell clusters appear to be less active.
The take home message is that biofilms are criss-crossed by gradients in the concentrations of metabolic substrates and products. This leads to a great deal of physiological heterogeneity. Microbial cells can occupy states from rapidly growing to dormant in the same biofilm. Antimicrobial agents may not be effective against cells in all of these diverse states.
